The Triangle

In 2023, Lotus Campaign began facilitating housing for people experiencing homelessness in Raleigh. The Triangle area is the second market Lotus Campaign has launched its Landlord Participation Program. Over the next five years, Lotus anticipates facilitating housing for 500 people.
In Raleigh alone, homelessness has increased by more than 50% since 2020, according to the U.S. Department of Housing & Urban Development. Raleigh has a shortage of more than 30,000 affordable housing units available to extremely low-income residents.
Neighborhoods of Opportunity
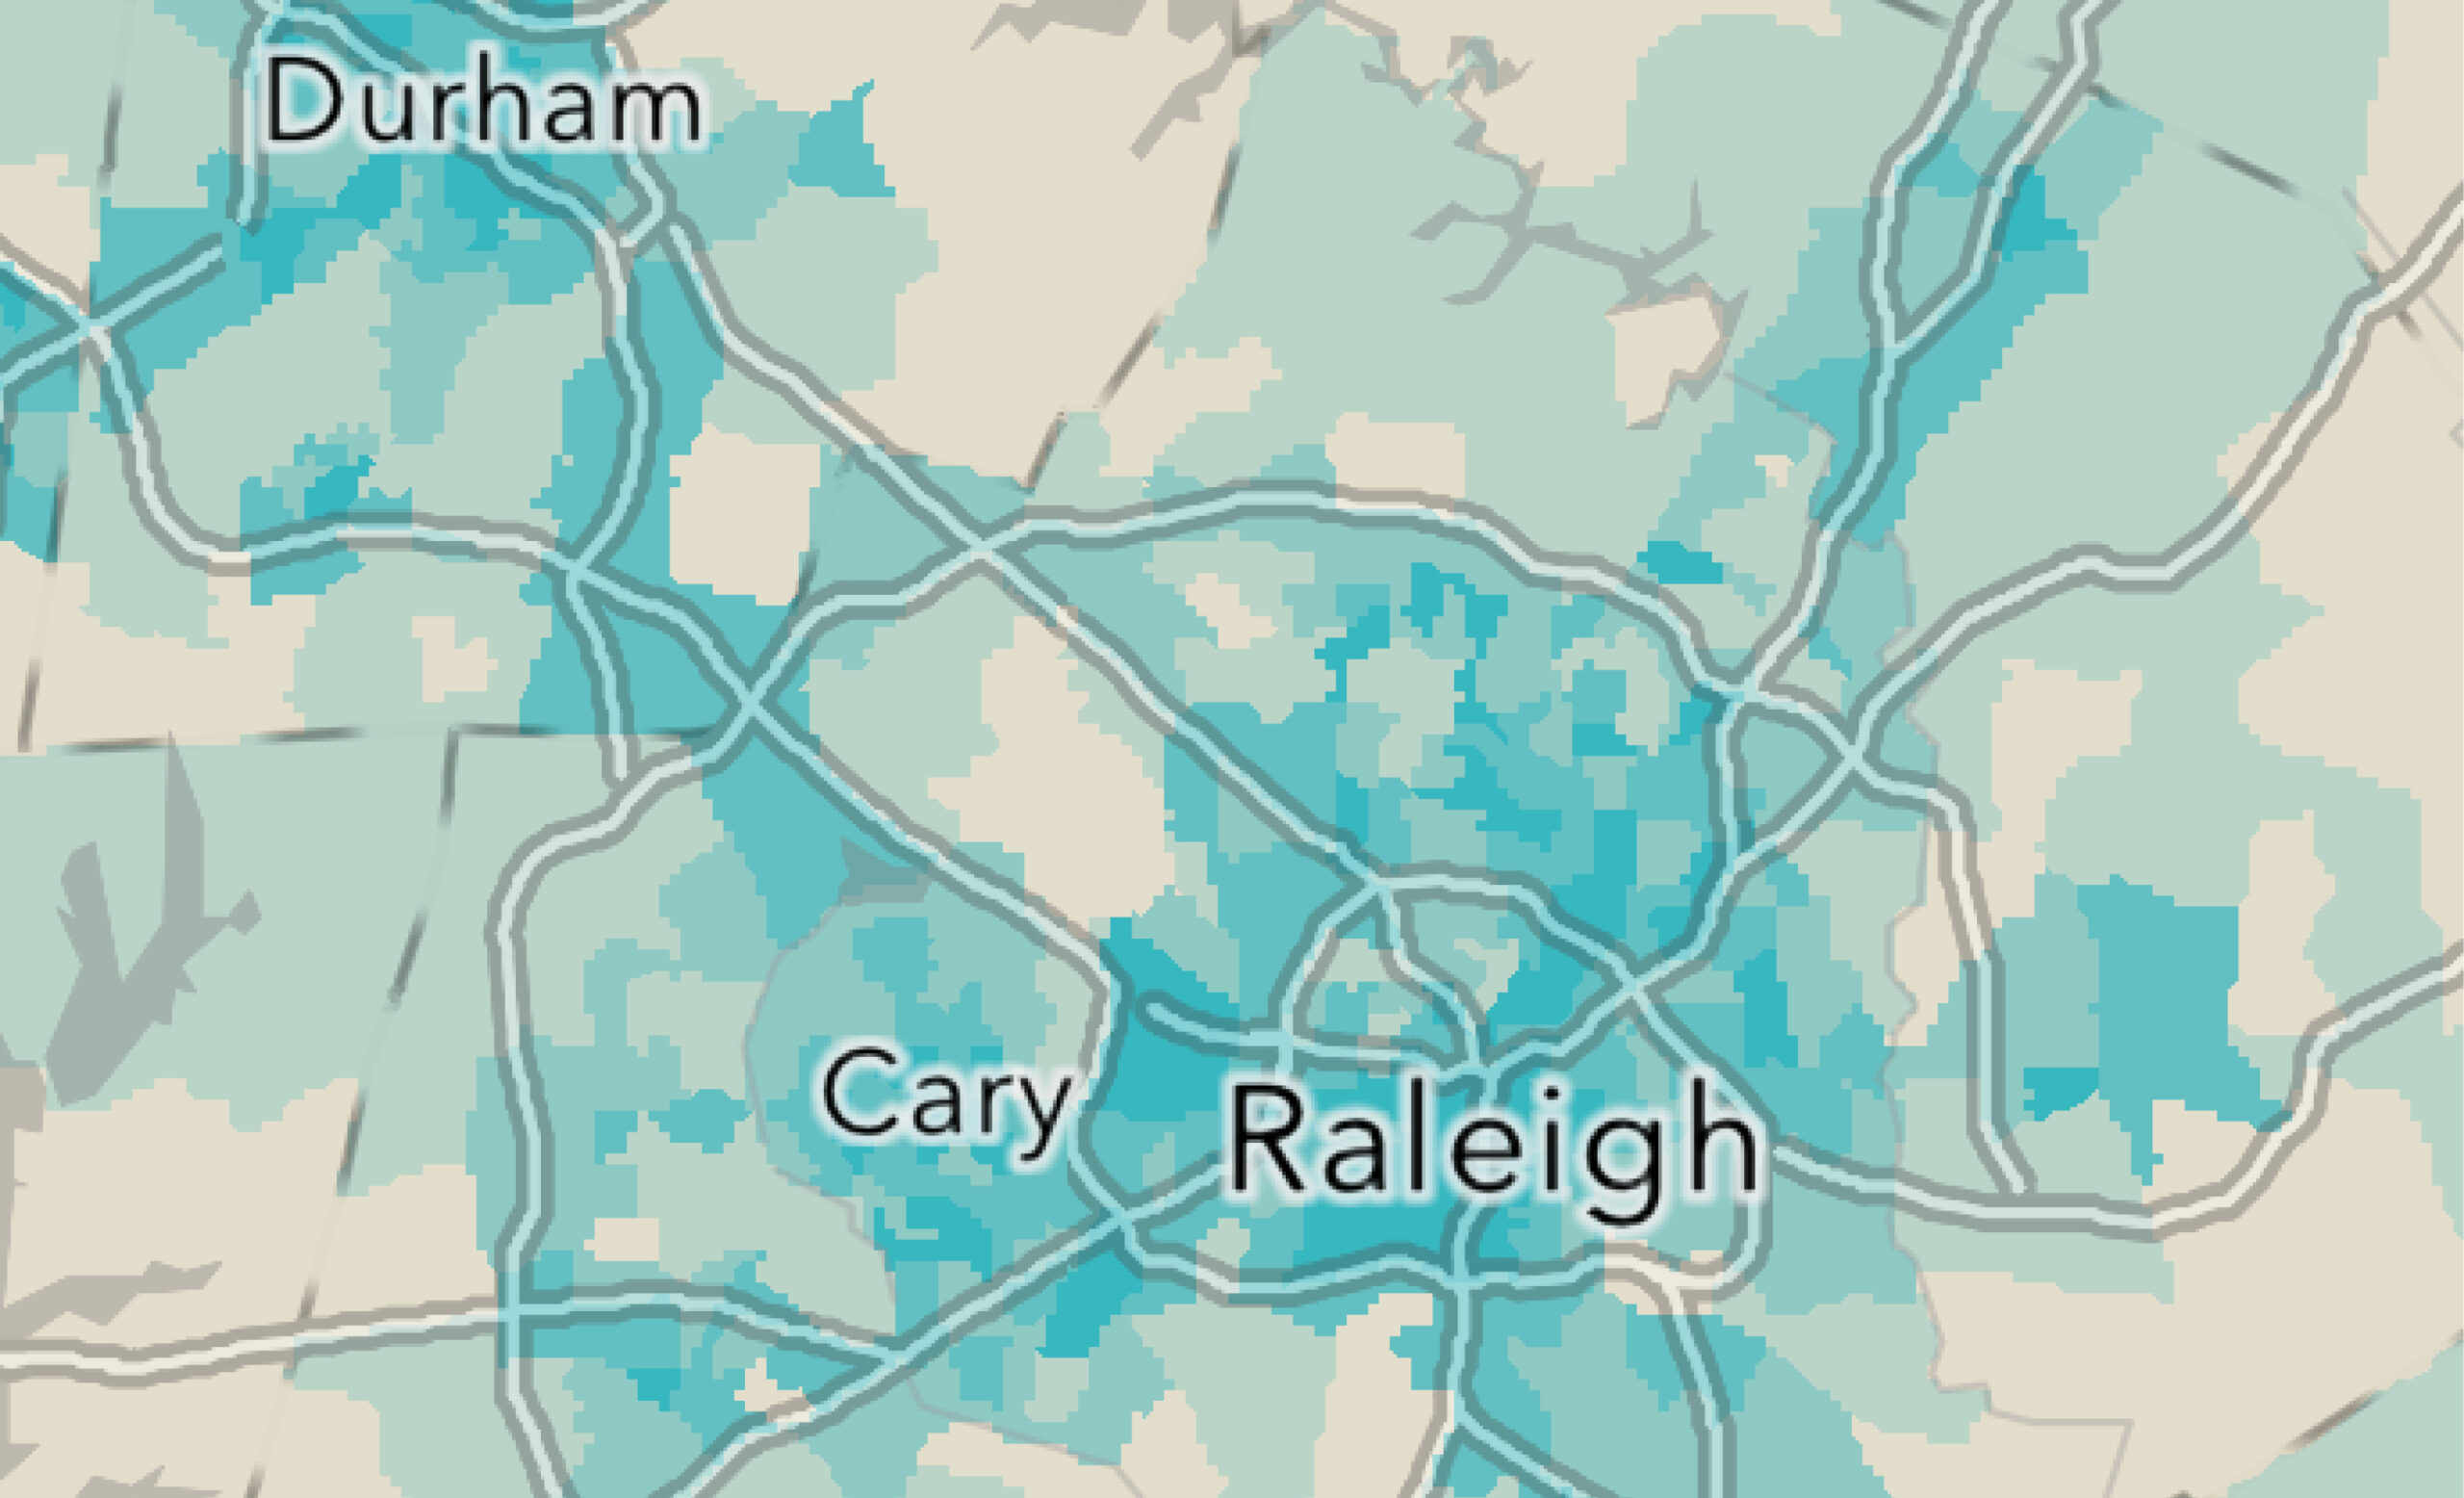
In the following map, we showcase where our current partner properties are throughout the Triangle area. We call these areas Neighborhoods of Opportunity.
We know not every roof is created equal. That’s why Lotus Campaign is intentional with where it facilitates housing. It is a key differentiator of our model that understands solving homelessness must be holistic. The housing that those who have recently been homeless can afford — either on their own or with some assistance — is often in already marginalized communities with high levels of poverty.
In contrast, Lotus partners with landlords who have communities close to public transportation, walkability, schools, major employers, and grocery stores. See the right side of our map for all the inputs into what allows us to identify a Neighborhood of Opportunity, where our sponsored residents have the greatest chance of rebuilding their lives. The importance of the proximity of these elements cannot be overstated.

To see live data please view on desktop.
Index of Indicators
Lotus Campaign Properties: Properties owned and managed by participating landlords where Lotus Campaign facilitates housing within its Landlord Participation Program.
Other Public Housing Opportunities: Properties in Lotus pilot communities that are either LIHTC (Low Income Housing Tax Credit) properties or local housing authority properties.
Bus and Transit Stops: Opportunities for sponsored residents to use public transportation to travel to and from work, schools, and grocery stores.
Employment Density: The number of jobs available within a certain radius or land area.
EPA Smart Location Score: The EPA’s Smart Location Calculator is a “dataset and interactive tool that measures the location efficiency of workplace locations.”
Social Vulnerability Index: According to the Center for Disease Control, “Social vulnerability refers to the potential negative effects on communities caused by external stresses on human health. Such stresses include natural or human-caused disasters, or disease outbreaks. Reducing social vulnerability can decrease both human suffering and economic loss.”
% of Black or African American: The percentage of people identifying as Black or African American.
Median Household Income: A median household income is the middle income in a list of incomes in a household.
Land Use Mix: According to the U.S. Department of Transportation, “This indicator measures the average neighborhood-level diversity of destinations across a metropolitan area based on the mix of eight different employment types (office, retail, industrial, service, entertainment, education, health, and public sector) within each block group in the metropolitan area.
National Walkability Index: According to the EPA, “The National Walkability Index (2021) is a nationwide geographic data resource that ranks block groups according to their relative walkability.”

